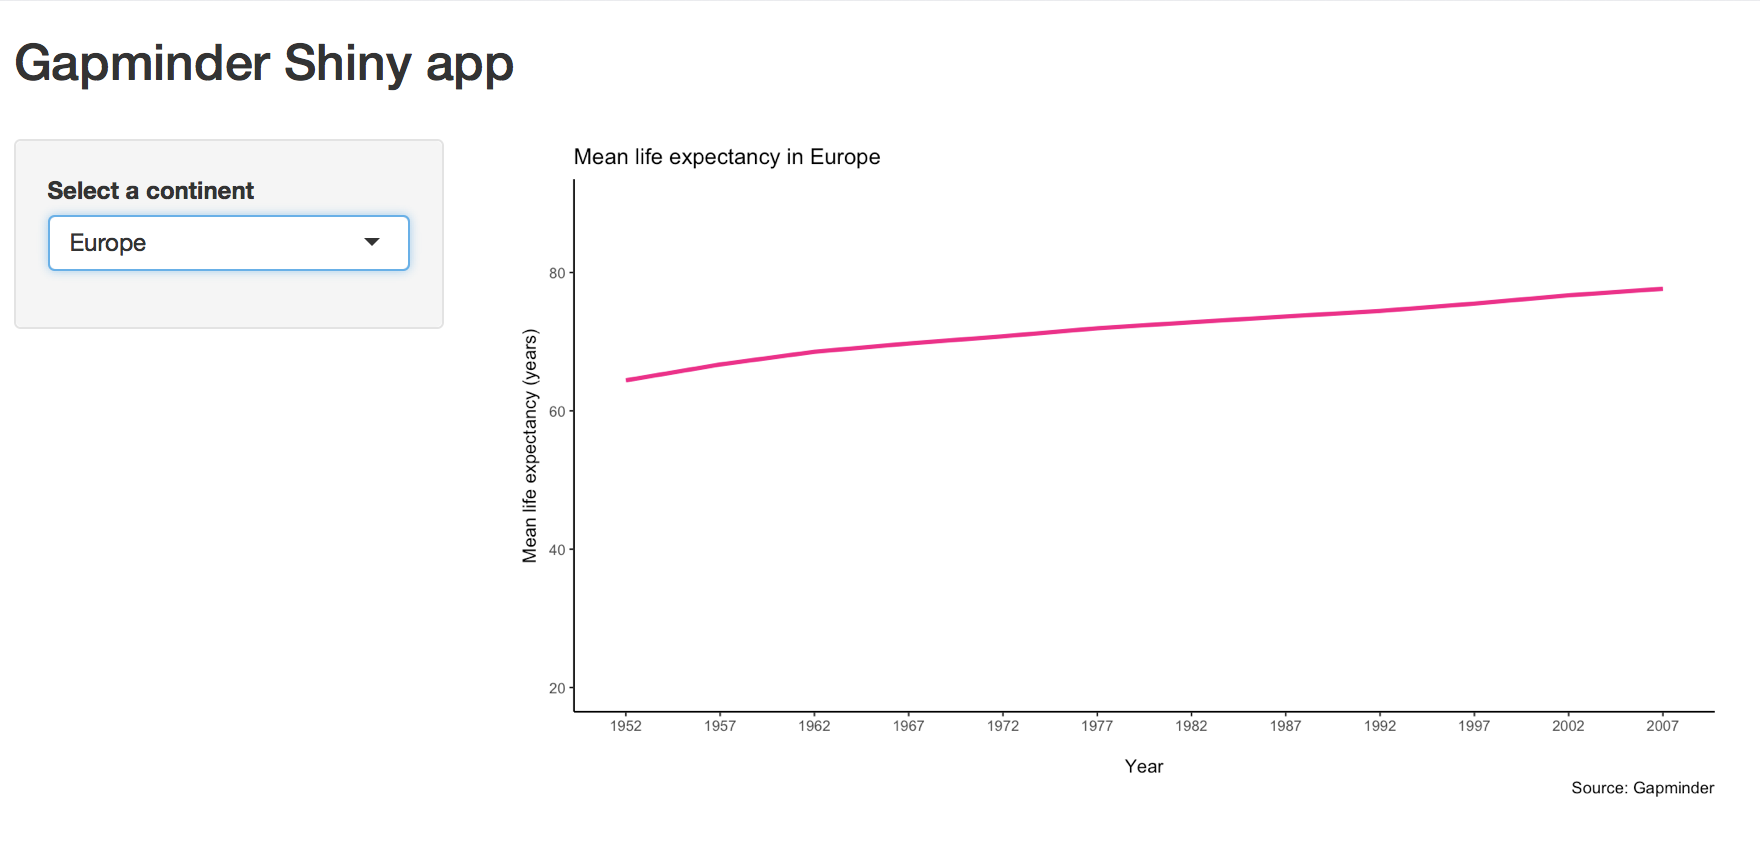
class: center, middle, inverse, title-slide # <div style="white-space: pre-line;">Getting Started in R an introduction to data analysis and visualisation</div> ## Shiny ### Réka Solymosi and Henry Partridge --- class: inverse, center, middle  --- # What is Shiny? -- - An R package developed by [RStudio](https://www.rstudio.com/products/shiny/) that allows data analysts to analyse, visualise and share their results with non-R users -- - Interactive web applications connected to an R session -- - No knowledge of HTML, CSS, and JavaScript is required but web apps are customisable and extendible -- - Integrates with JavaScript libraries -- - Uses a reactive programming framework. An input is sent to an R process which generates a plot in a web browser. --- # Advantages of Shiny -- - The process of loading, cleaning, manipulating and visualising data is possible entirely within R -- - Lowers barrier of entry to web development -- - R bindings for JavaScript visualization libraries becoming available all the time -- - Open source code encourages collaboration --- # Structure of an app Each Shiny app has two components: a UI (web page) and a server function (live R session). ```r library(shiny) ui <- fluidPage() server <- function(input, output){} shinyApp(ui, server) ``` The UI specifies the layout and user interface elements, e.g. HTML widgets like drop-downs, sliders, radio buttons etc., whilst the server specifies how to generate the output, e.g. table, plot, text. --- class: inverse, center, middle # Demo --- # Load the packages ```r *library(shiny) *library(tidyverse) *library(gapminder) *library(ggplot2) ui <- fluidPage() server <- function(input, output){} shinyApp(ui, server) ``` --- # Test run the template ```r library(shiny) library(tidyverse) library(gapminder) library(ggplot2) *ui <- fluidPage() *server <- function(input, output){} *shinyApp(ui, server) ``` You can run this template to boot up the draft webpage after you have made editions. --- # Read (and manipulate) the data ```r *df <- gapminder %>% * group_by(continent, year) %>% * summarise(mean_lifeExp = mean(lifeExp)) ui <- fluidPage() server <- function(input, output){} shinyApp(ui, server) ``` But we still haven't actually added anything to the webpage yet. --- # Add a title ```r library(shiny) ; library(tidyverse) ; library(gapminder) ; library(ggplot2) df <- gapminder %>% group_by(continent,year) %>% summarise(mean_lifeExp = mean(lifeExp)) ui <- fluidPage( * titlePanel("Gapminder Shiny app") ) server <- function(input, output){} shinyApp(ui, server) ``` Now we've added a title. --- # Add a layout ```r library(shiny) ; library(tidyverse) ; library(gapminder) ; library(ggplot2) df <- gapminder %>% group_by(continent,year) %>% summarise(mean_lifeExp = mean(lifeExp)) ui <- fluidPage( titlePanel("Gapminder Shiny app"), * br(), * sidebarLayout( * sidebarPanel(width = 3), * mainPanel()) ) server <- function(input, output){} shinyApp(ui, server) ``` --- # Add a reactive input ```r library(shiny) ; library(tidyverse) ; library(gapminder) ; library(ggplot2) df <- gapminder %>% group_by(continent,year) %>% summarise(mean_lifeExp = mean(lifeExp)) ui <- fluidPage( titlePanel("Gapminder Shiny app"), br(), sidebarLayout( sidebarPanel(width = 3, * selectInput(inputId = "continent", * label = "Select a continent", * choices = levels(df$continent), * selected = "Europe") ), mainPanel())) server <- function(input, output){} shinyApp(ui, server) ``` --- # Add a reactive ```r library(shiny) ; library(tidyverse) ; library(gapminder) ; library(ggplot2) df <- gapminder %>% group_by(continent,year) %>% summarise(mean_lifeExp = mean(lifeExp)) ui <- fluidPage( titlePanel("Gapminder Shiny app"), br(), sidebarLayout( sidebarPanel(width = 3, selectInput(inputId = "continent", label = "Select a continent", choices = levels(df$continent), selected = "Europe")), mainPanel())) server <- function(input, output){ * data_points <- reactive({filter(df, continent == input$continent)}) } shinyApp(ui, server) ``` --- # Add a reactive output ```r library(shiny) ; library(tidyverse) ; library(gapminder) ; library(ggplot2) df <- gapminder %>% group_by(continent,year) %>% summarise(mean_lifeExp = mean(lifeExp)) ui <- fluidPage( titlePanel("Gapminder Shiny app"), br(), sidebarLayout( sidebarPanel(width = 3, selectInput(inputId = "continent", label = "Select a continent", choices = levels(df$continent), selected = "Europe")), mainPanel( * plotOutput('plot') ))) server <- function(input, output){ data_points <- reactive({filter(df, continent == input$continent)}) } shinyApp(ui, server) ``` --- # Save output ```r library(shiny) ; library(tidyverse) ; library(gapminder) ; library(ggplot2) df <- gapminder %>% group_by(continent,year) %>% summarise(mean_lifeExp = mean(lifeExp)) ui <- fluidPage( titlePanel("Gapminder Shiny app"), br(), sidebarLayout( sidebarPanel(width = 3, selectInput(inputId = "continent", label = "Select a continent", choices = levels(df$continent), selected = "Europe")), mainPanel(plotOutput('plot')))) server <- function(input, output){ data_points <- reactive({filter(df, continent == input$continent)}) * output$plot <- } shinyApp(ui, server) ``` --- # Build reactive output ```r library(shiny) ; library(tidyverse) ; library(gapminder) ; library(ggplot2) df <- gapminder %>% group_by(continent,year) %>% summarise(mean_lifeExp = mean(lifeExp)) ui <- fluidPage( titlePanel("Gapminder Shiny app"), br(), sidebarLayout( sidebarPanel(width = 3, selectInput(inputId = "continent", label = "Select a continent", choices = levels(df$continent), selected = "Europe")), mainPanel(plotOutput('plot')))) server <- function(input, output){ data_points <- reactive({filter(df, continent == input$continent)}) output$plot <- * renderPlot({ * )} } shinyApp(ui, server) ``` --- # Access input values ```r library(shiny) ; library(tidyverse) ; library(gapminder) ; library(ggplot2) df <- gapminder %>% group_by(continent,year) %>% summarise(mean_lifeExp = mean(lifeExp)) ui <- fluidPage( titlePanel("Gapminder Shiny app"), br(), sidebarLayout( sidebarPanel(width = 3, selectInput(inputId = "continent", label = "Select a continent", choices = levels(df$continent), selected = "Europe")), mainPanel(plotOutput('plot')))) server <- function(input, output){ data_points <- reactive({filter(df, continent == input$continent)}) output$plot <- renderPlot({ * ggplot(data_points(), aes(x = year, y = mean_lifeExp)) + * geom_line(color = "deeppink2", lwd = 1.2) + * scale_x_continuous(breaks = seq(1952, 2007, 5)) + * scale_y_continuous(breaks = seq(0, 80, 20), limits = c(20, 90)) + * labs(title = paste("Mean life expectancy in", input$continent), * x = "\nYear", y = "\nMean life expectancy (years)", caption = "Source: Gapminder") + * theme_classic() + * theme(legend.position = "none")})} shinyApp(ui, server) ``` --- # Run and deploy the app 